Reading and Interpreting Reports in Analytics for Contact Center
Objective
Learn about Analytics for Contact Center reports and how to read the various sections.
Applies To
- Analytics for Contact Center
Important Information to Consider
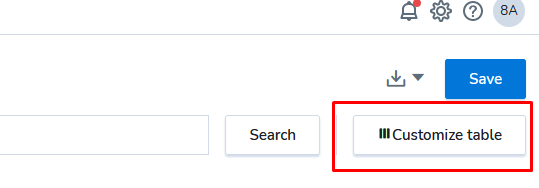
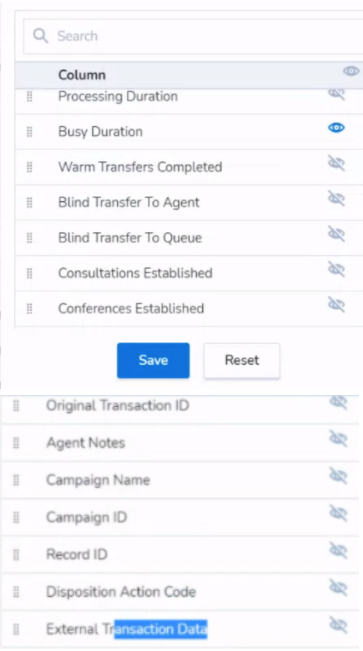
Customize your table
- All Reports can be customized to include other headers to see the information you want to see.
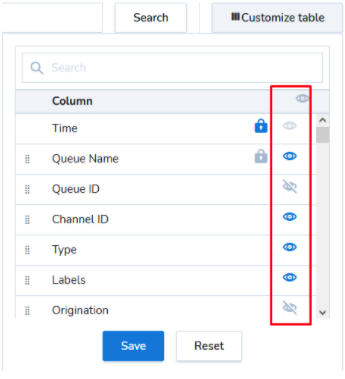
- Click the Customize button on the right side of your screen from any table report
- From the drop down hide or see the columns you want to see. What Columns are available depends on the table you are in
Limitations of Analytics for Contact Center Reports
- You are not able to generate a report for deleted agents in any version of Analytics for Contact Center before version 2.5.0. However the data for deleted agents once in Analytics will be computed still and therefore will be included in the queue calculations.
- Preview mode is only meant to show you a sample of how things will look. it will show the aggregation of data for up to 50 entries. Once saved you will get your full data.
What's included in metrics
- Queue Interactions > Summary includes Entered and Accepted Metrics
- Detailed Reports > Interactions includes Entered and Accepted Metrics
Metrics for Rejected Interactions
There are 2 Metrics for Rejected:
- Rejected Timeout is the calls that just timed out and did not get answered
- Rejected is the calls that were actually rejected either by pressing the reject button, or the agents phone had been pressed for reject before the timeout occurred.
When trying to match up Rejected figures between reports, make sure the Rejected figures selected are the same between reports.
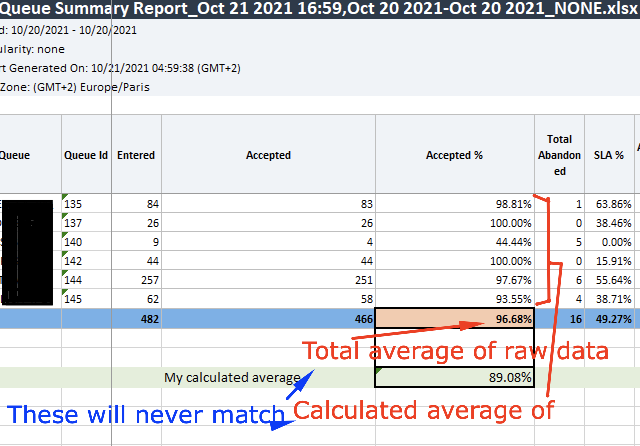
Averages
Total Averages showing at the bottom of reports are the total averages calculated from the raw data.
If you try to average the averages they will not match since the totals at the bottom are not averages of averages.
Filtering Agent Interactions Report
The report Agent Interactions that is looking at Queues, also includes records that do not go through a queue. You can see this by checking or un-checking No Queue from the queue filter of the report.
Agent status change report
Includes logged in and out with the actions performed by agents such as On Hold, Take off Hold, Muted etc.
- Also will include Status Code list
- You can show and hide columns you want.
- ID's are auto hidden by default but are there - you can make them visible
- Now includes a search bar
- Some records will come in pairs for instance "busy" and "offered" status will come with the same time stamp as the interaction of "offered" will occur at the same time as being put onto "busy" status.
- You can filter by status
- Also shows calls that didn't change agent status for instance direct agent calls
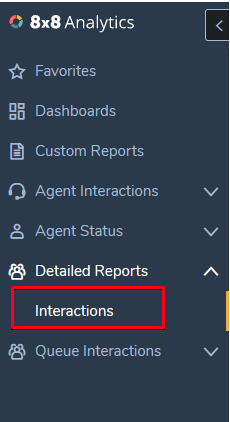
Seeing All Interactions
The report Detailed Report: Interactions gives you a breakdown of all the interactions associated to a report.
The first column entitled "Time" is created time of an interaction. This is not the time the agent is doing the interaction, so for callbacks and campaigns for instance an interaction can be created, but it can be hours later before an agent handles the interaction. You can more clearly see what times the agents handled the interactions by Customizing your table.
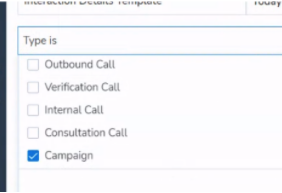
- Now includes Campaign details.
- You can search specifically for Campaign interactions
- There are new columns for the data to incorporate needed things for campaigns:
- Can save the report and then access the saved reports via "Custom Report"
- Columns will remain empty if not applicable
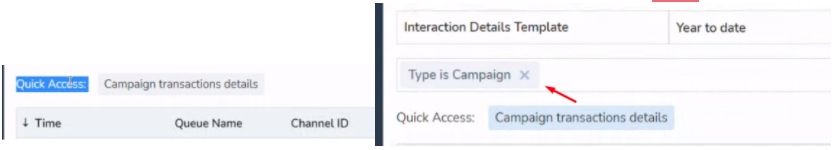
- Now has a Quick Access Links available - like a direct link (shortcut) to just that type of call (prefills the filter)
- Currently only 4 disposition codes can show (the auto ones no manual ones)
- The Campaign abandoned metric is not included at present - the abandoned label that you see in the labels column is not being covered for campaigns. It will be a different metric and differently calculated and defined when it's added.
- The detailed report is sorted by when a record is created. So if you're looking for something created (such as a campaign record) before the day it was called it would be on the day before date.
Calculations
Metrics are calculated as follows for various settings:
- Presented = Accepted + Rejected + Reject Timeout +Abandoned + Alerting This calculates the presented figure for any time slot including how many times it's presented to individual agents, as well as same agent repeatedly presented. Presented is an Agent Metric.
- Entered=Accepted + Abandoned by the client + Diverted + Waiting in queue This means that Entered figure for any time slot is what entered in that timeslot plus anything that is still in the queue in the previous time slot (This will lead to the individual time slots (i.e. split down by 15/30min or 1hr), when added up, will not match the overall total at the top of the list.) Entered is a Queue Metric.
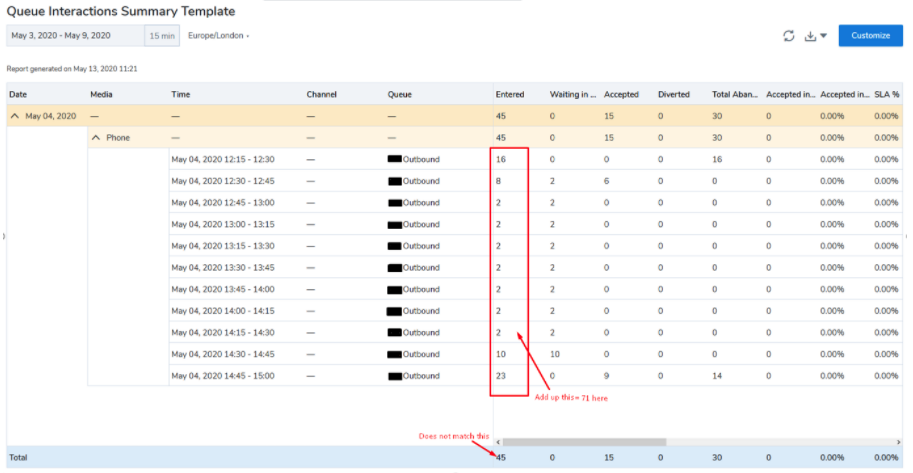
Intervals vs Totals
When looking at interval time slots (ie 12:15-12:30) several figures when adding up the time slot will not equal the total (which only counts each call once.) I showed Entered figures above doing this, however it will affect other settings in the following ways:
Handling Time and Average Handling time - Calls that cross time slots will count as their full time value in both time slots. For Example, if a call comes in during one time slot (ie 12:15-12:30) and then falls into a second time slot, this will be shown twice - once in 12:15-12:30, and once in 12:30-12:45 - both counting the full amount of handling time/Average Handling time for that call. If the call is longer than 2 time slots it will count three times, etc. Because of this, adding up the intervals for these figures will not match the totals.
Comparing Dashboards
When comparing Dashboards, please be aware of the following information.
Troubleshooting Inconsistent Data
When things do not match, check that the reports have the same filters - such as does one include logged out agents and another doesn't?
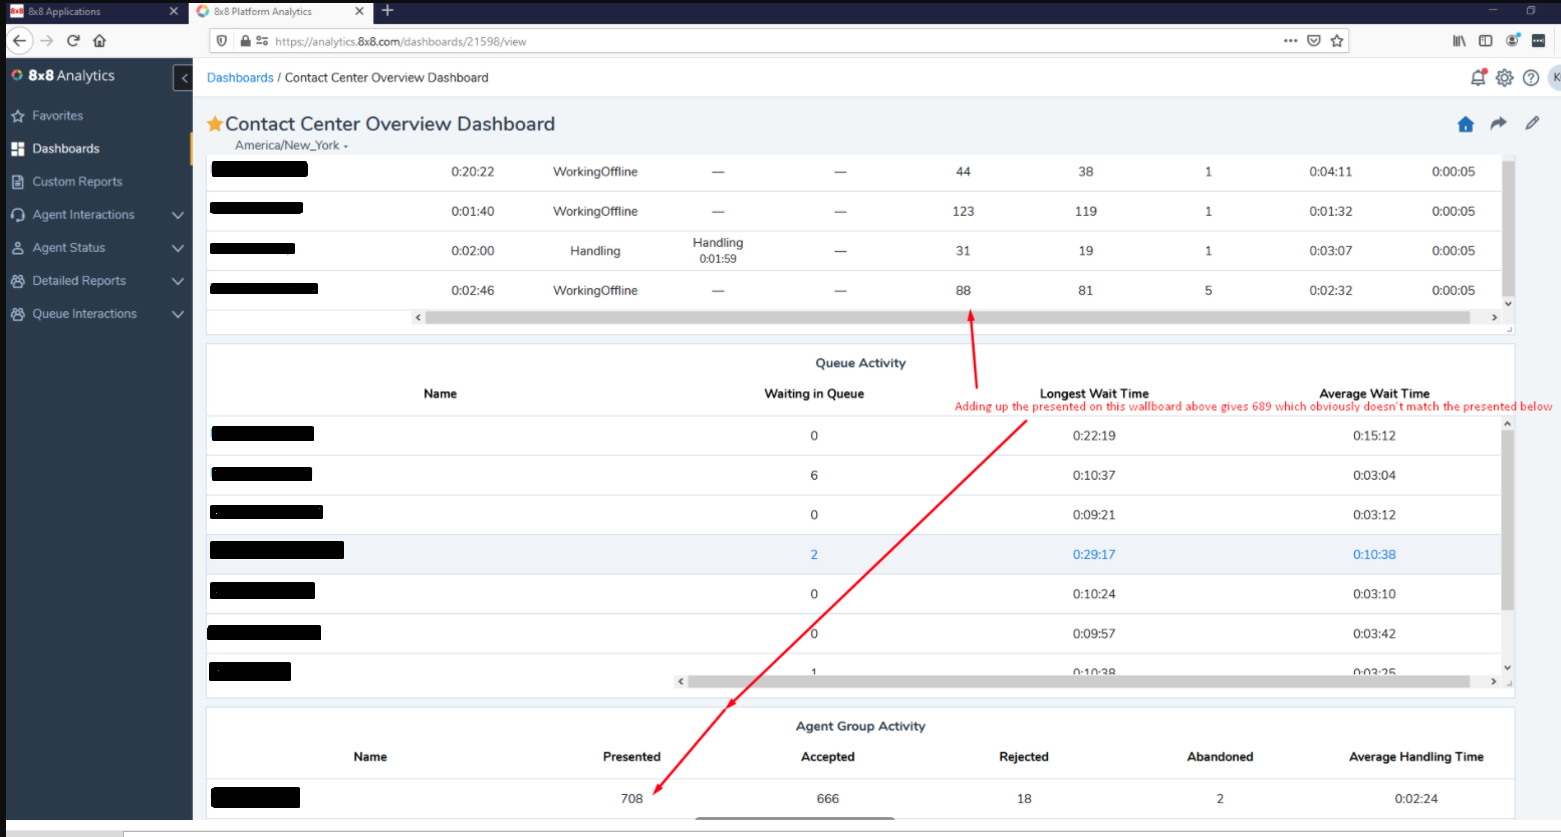
Also in addition to checking filters, Agent Group Activity Widget, does not update as often as Agent performance widget.
Agent group Activity Widget updates every hour and therefore is historical data.
Agent performance widget is expected to update every 5 seconds.
Agent time on status report refreshes every 15 minutes.
Outbound Codes
Data for Outbound codes and the ability to filter on them, is only available from when a tenant is upgraded to Contact Center 9.10. Data will not be available for this before this date.
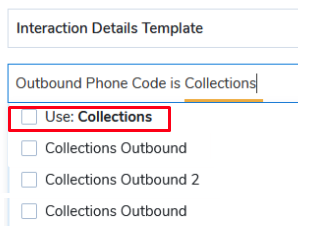
Please be careful naming your outbound codes in Contact Center. If you have the same code name under 2 different lists, it will show up individually in the filter list and it can make it difficult to tell which is which, and can make a difference in the filters.
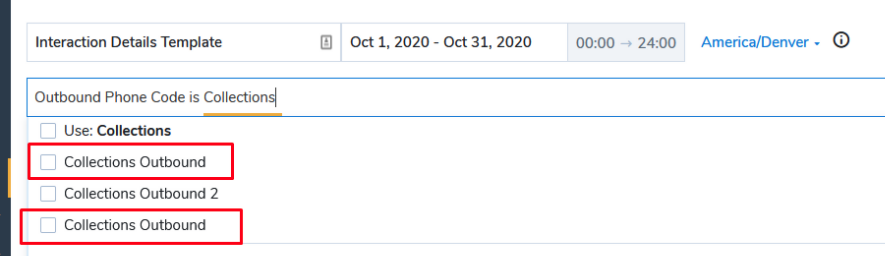
If you use the Use:typed data (ie in example above select the Use:Collections) it will bring back all that match that criteria and not just the selected code.
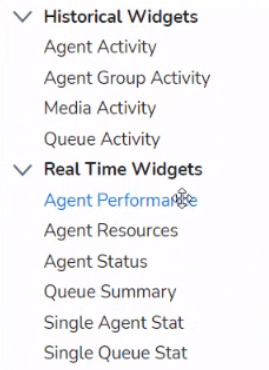
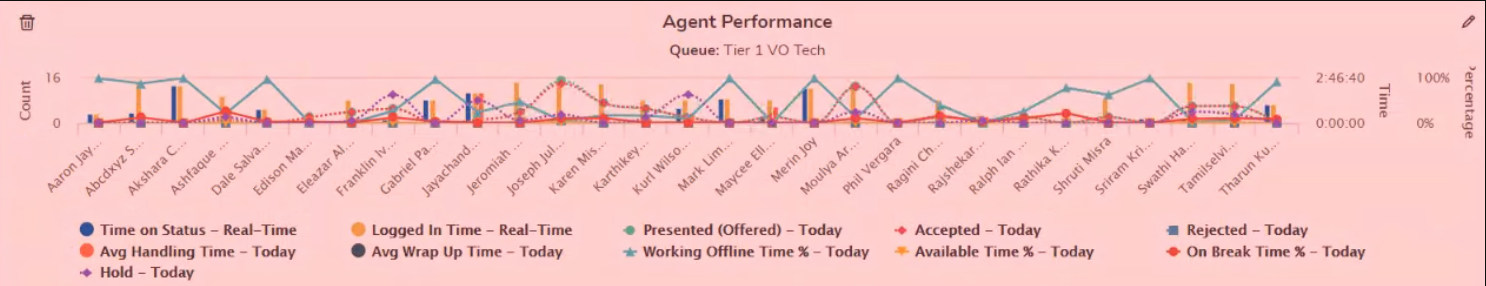
Agent Performance vs Agent Activity
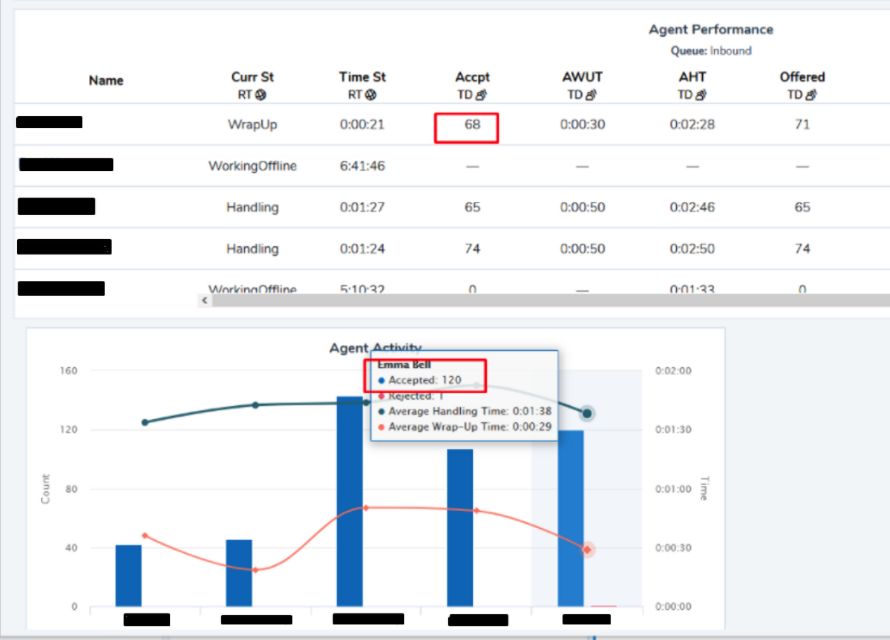
Agent Performance is configured with a Queue Resource and so will only contain agent's activity specific to selected queue. This widget can be made to show overall activity made by the agents by using the Agent Group Resource instead of the Queue resource. (Real time widget - updates every 5 seconds)
Agent Activity widget contains overall activity made by agents on all queues and outside of queues (such as direct inbound calls, direct outbound calls, consultations etc which do not go through queues at all) (Historical widget - updates 10s of minutes to an hour at a time) - Other Historical widgets include Queue Activity, Group Activity, Media Activity which also refresh every hour.
Other Dashboards
- There are new ways to visualize data:
- "Big Number" is only up to 3 metrics each giving a grand total of that metric.
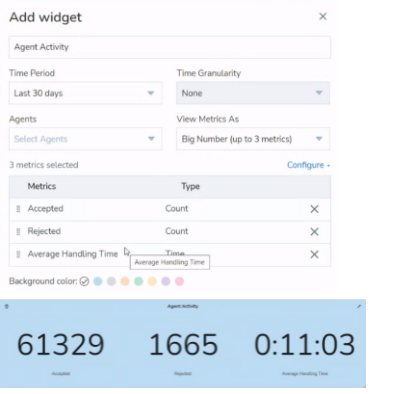
Colours can be changed on the dashboards - For this "Big Number" widget is a max of 3 per widget, however you can have multiple widgets
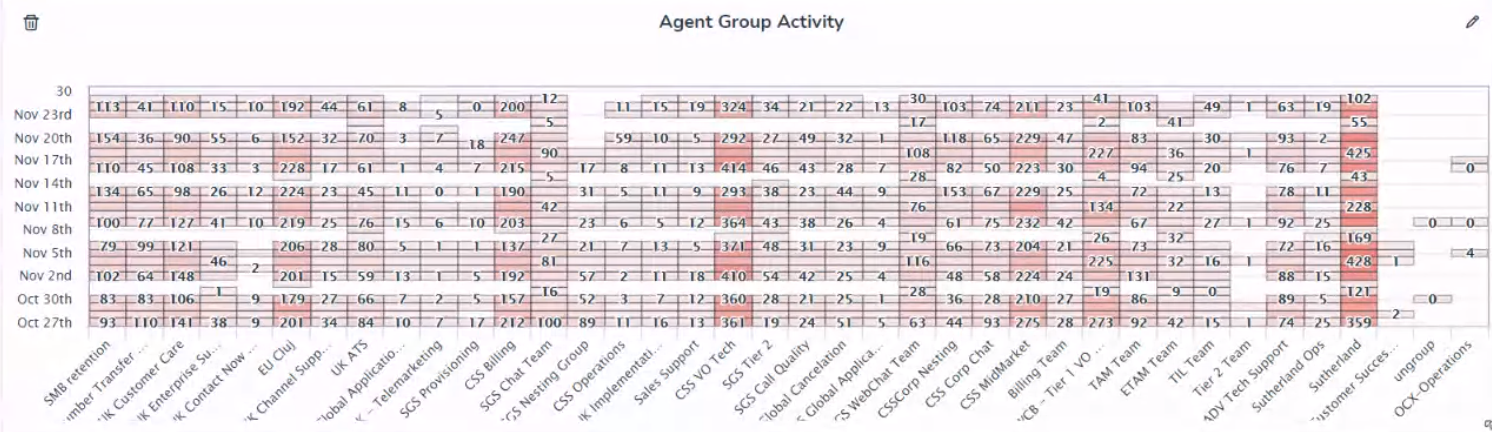
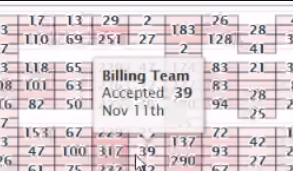
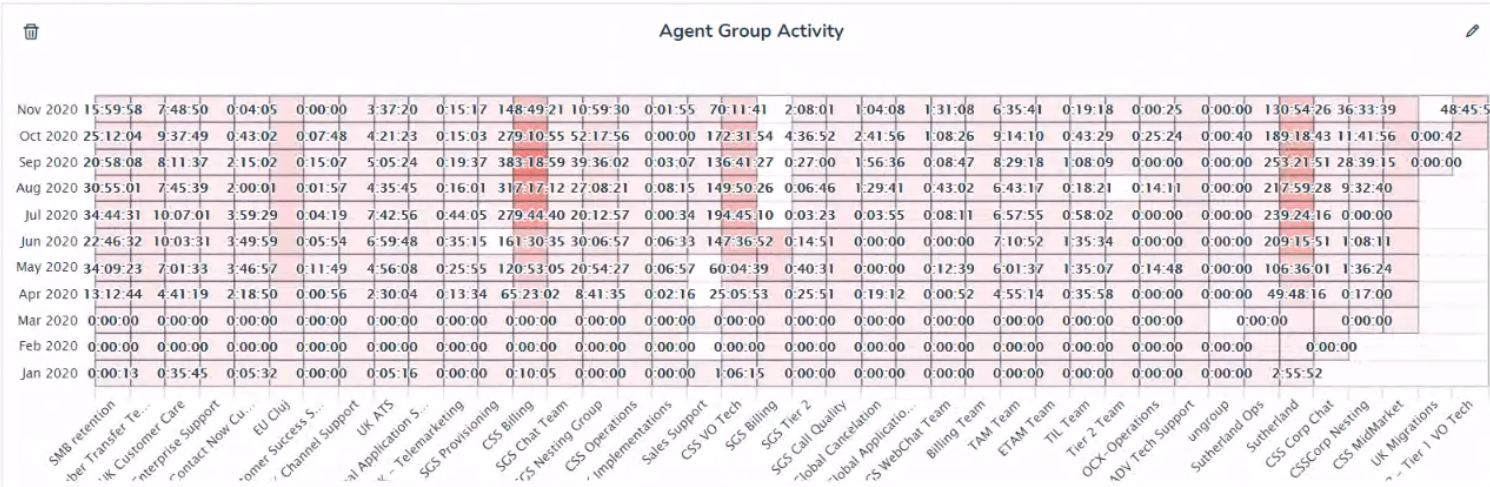
- Agent Group Activity Widget: can now see a graphical representation of it that has darker the shade, greater the quantity. Hover over a square to see the specific box data:
- Metrics are extended so there are now more metrics to filter by
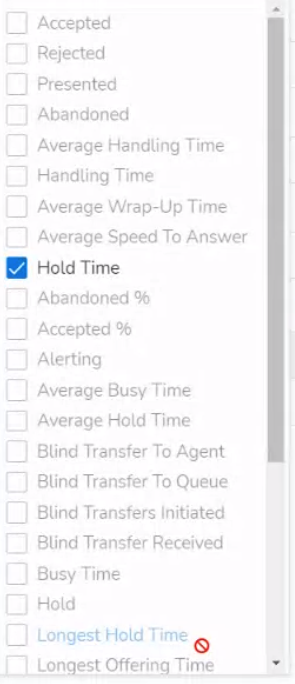
- If you choose hold time you can have a heat map of it. Select the dates and granularity and it will display in the same way as above.
- Note for this chart there is a maximum of 1000 cells. If there are more than 1000 cells then it will bring up an error stating the widget is incomplete.
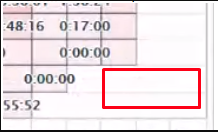
- If there is no colour it means there is no activity for that timeslot for the metrics requested - so for the example of hold you get the following graph:
you see there is no data in the bottom right so this implies no activity at all occurred.
- If it shows 0:00:00 this means that the activity did occur, however it did not change the metric, ie in the hold example above - a call occurred but no calls were put on hold)
Queue Activity Dash:
- Now available in a line chart (as also some other dashboards)
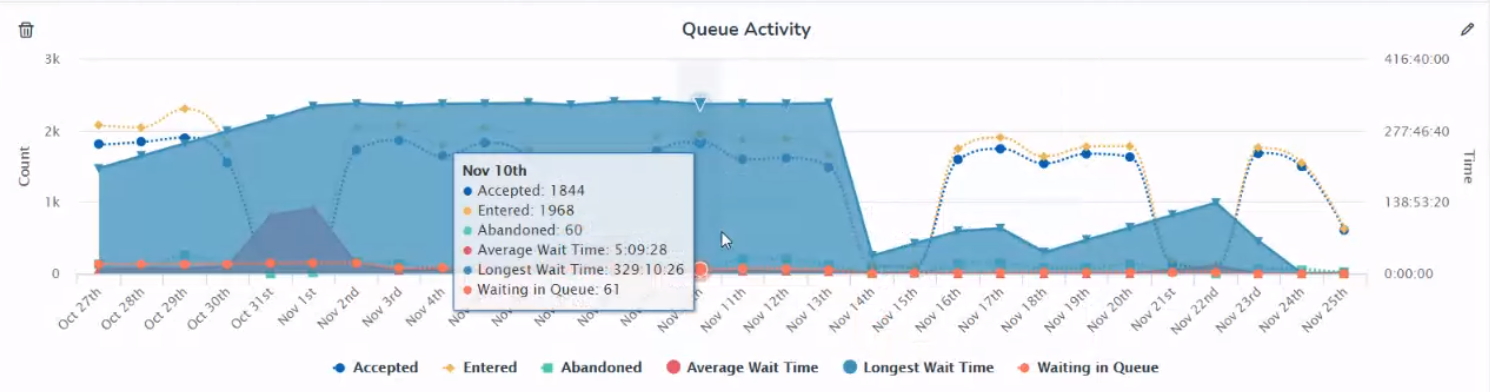
- There is an option to show the grand totals (in case they're missing)
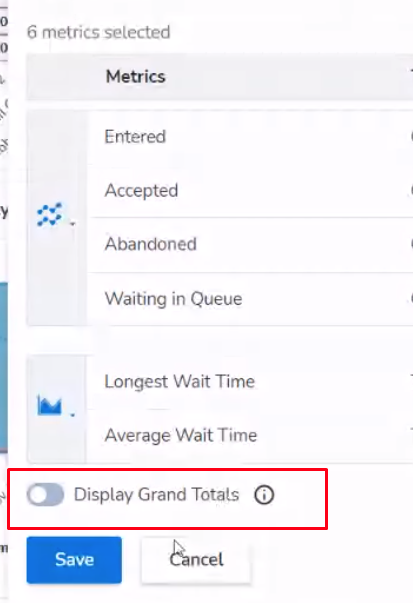
- When totals are enabled they appear in the legend
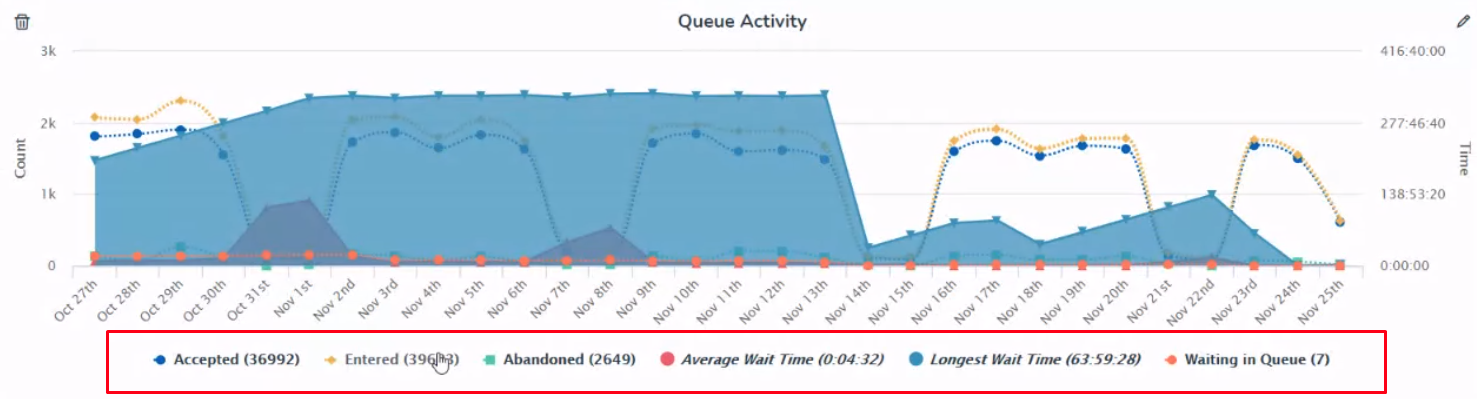
- When looking at the "Waiting in Queue" total this is what was left in queue at the end of the time period in question.
- Totals are only available for historical metrics at present.
Real Time Widget:
- Chart has been upgraded to be chart and line
- Chart refreshes every 5 seconds like all real time data info
- If you want to download charts you have to download them separately of the table data but are available in different file formats.
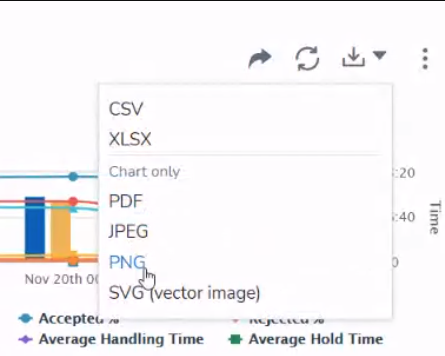
- There is no way to download both at the same time at this moment in time.
- Deleted agents are now visible in agent interactions summary.
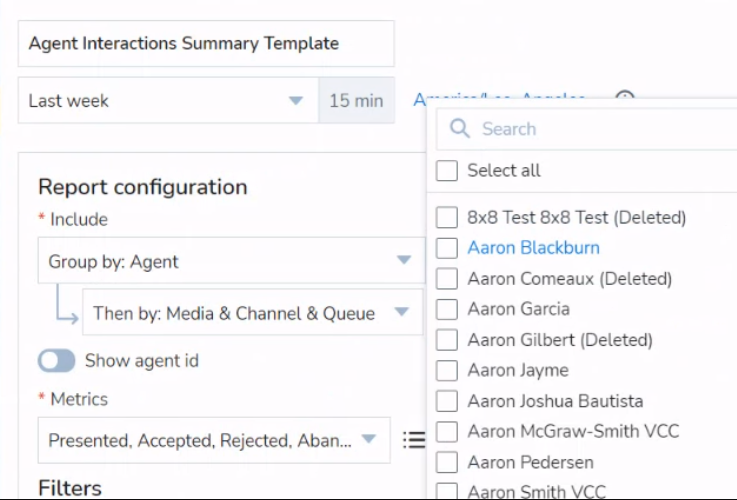
- These are now included in all the aggregated and detailed reports as well as dashboards
Other details
- Supervisor and admin roles only should be able to access from SSO, but it should not show for those in SSO application panel if not admin or supervisor
- Interactions report API being worked on and hoping to release Jan
- If you are trying to schedule a report for someone not showing in the list (which anyone that hasn't logged into analytics will not show) you can put in their email address now to send the scheduled report.