Step-by-step instructions to define a threshold in Analytics for Contact Center
Applies To
- Contact Center
- Configuration Manager
- Wallboards
Answer
-
Login into Analytics for Contact Center
-
Use a direct URL: http://analytics.8x8.com/
-
Or from the 8x8 Applications Panel: https://sso.8x8.com/applicationPanel
-
Or from the Agent Workspace Menu
-

-
Go to Settings > Thresholds and choose to define New Set.


-
Choose to select either a Queue Set or Agent Set.

-
In the Threshold setup Panel, define:
-
The metric type ( Today window Intervals )
-
The specific metric you are interested to monitor closely ( can choose from a predefined list of default or custom metrics )
-
Specify the Warning levels values, colors and/or sounds to play
-
Warning Level
-
Danger Level
-
Success Level
-
-

-
After saving the Threshold setup, you can set a dedicated name for it and assigned it to desired queue/s


-
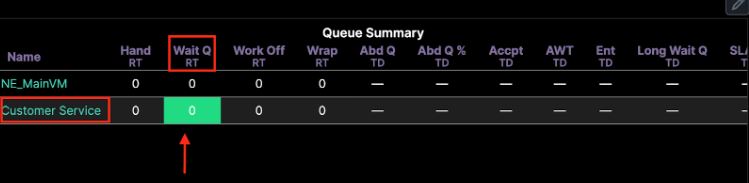
The set threshold will appear in the Dashboard / Wallboard, for the selected metric and queue