How to Use Ping Plotter for Network Troubleshooting
Overview
PingPlotter is a 3rd party application that 8x8 recommends getting additional information on Network Connectivity. 8x8 tools provide quality determinations based on the data as a whole received in either call simulations or actual calls from your device to 8x8 data centers, where PingPlotter tracks information at multiple points en route from your location to the 8x8 data centers.
Download and Install
PingPlotter can be downloaded from the PingPlotter website.
The use of the free version is recommended. After downloading, follow the installation instructions provided by PingPlotter.
Configuration
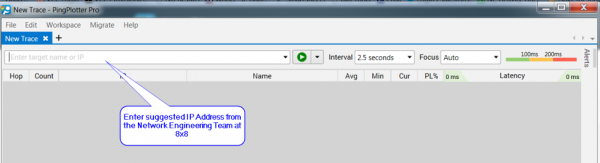
After PingPlotter is installed and running:
- In the Target Name or IP field, enter the IP address of the recommended data center.
- India: 152.67.22.1
- Amsterdam: 64.95.100.100
- Brazil: 168.90.173.118
- Singapore: 117.20.40.201
- West Coast US: 192.84.16.2
- East Coast US: 8.28.0.2
- United Kingdom: 217.163.57.2
- Australia: 103.239.164.2
- Hong Kong: 103.252.162.2
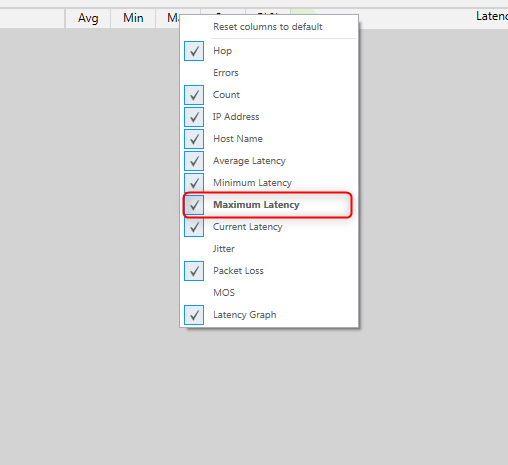
- Right-click on the top bar, over Avg, Min, Cur, and check Maximum Latency.
- Also ensure Focus is set to ''All'' and Interval is set to ''2.5 seconds''.
- Click Start.
- Click the + at the top left of the program to create a new trace.
- In the target field type in google.com, or the closest top-level domain for the region.
- Right-click on Min and add the Maximum Latency field
- Click Start.
The testing for Google will be used for a baseline.
Over time a graph is created to the right of the application providing statistics of packet loss and latency for each individual hop between your PC and the data center.
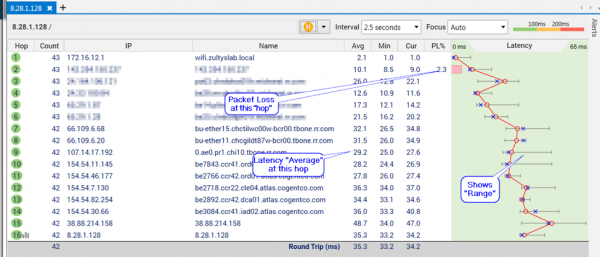
This information is read by 8x8’s Network Engineering team (or your IT Staff) to identify where packet loss or latency is being introduced into the call. From this, the 8x8 Network Engineering team can provide recommendations to resolve the issue.
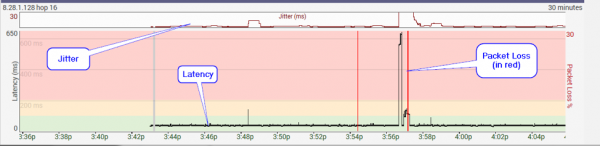
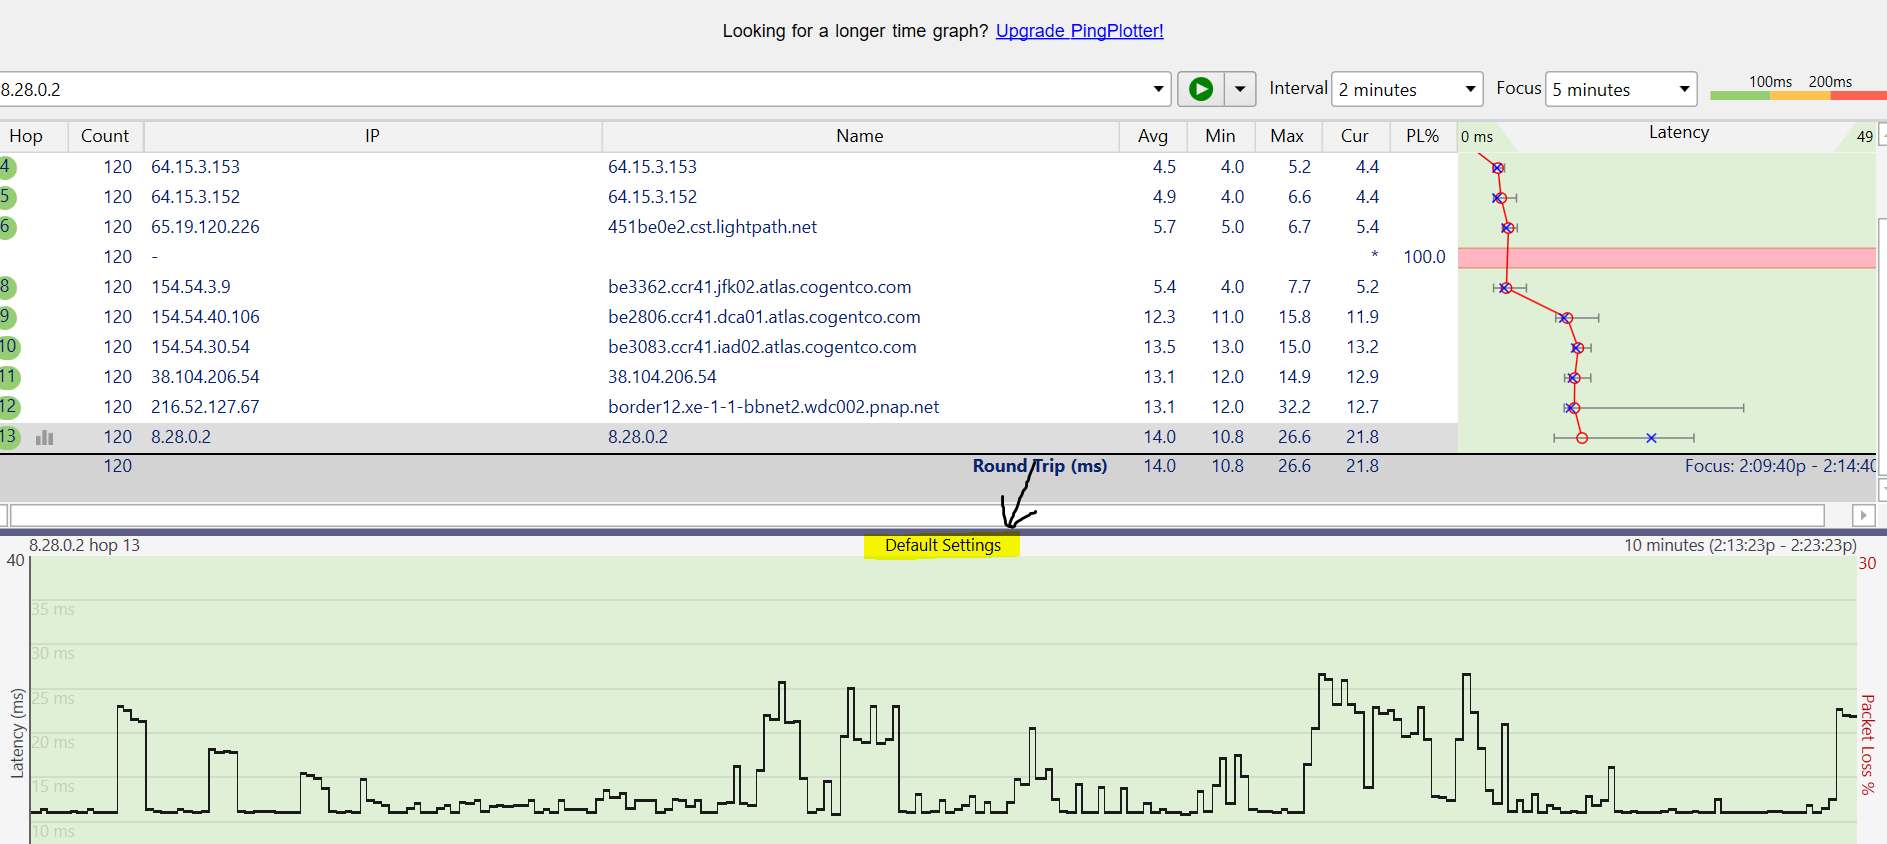
A complete graph is created showing the results over the duration of the test. To provide the most complete information, we recommend running the test for a minimum of 2 hours or for at least the duration of your business hours, if not 24 hours. This graph provides the three most important metrics graphed simultaneously: Jitter, Packet Loss, and Latency.
Change Run Time Range
The default run time is set to 10 minutes.
To change run time, right-click on Default Settings.
Stopping and Exporting Results
- Stop the test by clicking Pause.
- To export the data, click File then Export Sample Set.
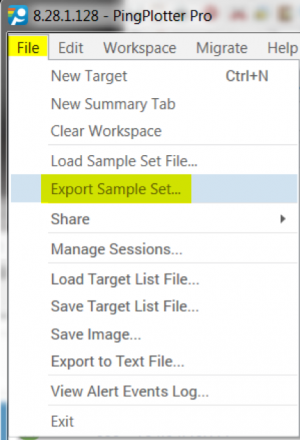
- Attach the Sample Set to an online support case for an 8x8 Engineer to review.
Note: Information on reading and interpreting PingPlotter results can be found here.