Create Analytics for Contact Center Dashboard for Call Queue Summary
Objective
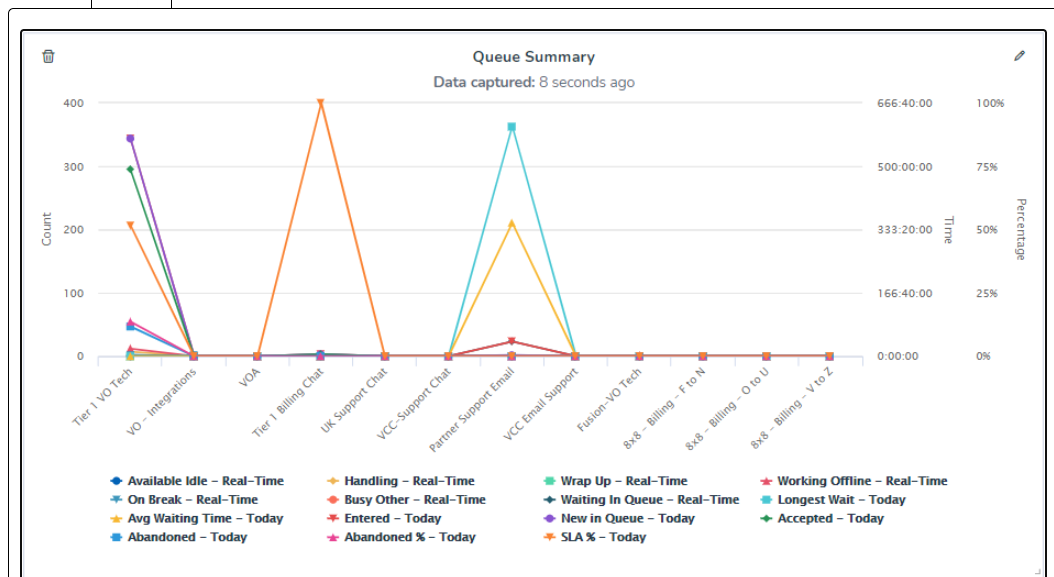
Create a dashboard to view call queue summary information, such as how many calls are waiting in the queue, or the average time of answering calls.
Applies To
- Analytics for Contact Center
- Contact Center Dashboard
- Call Queue Wallboard
Procedure
- Log in to Analytics for Contact Center.
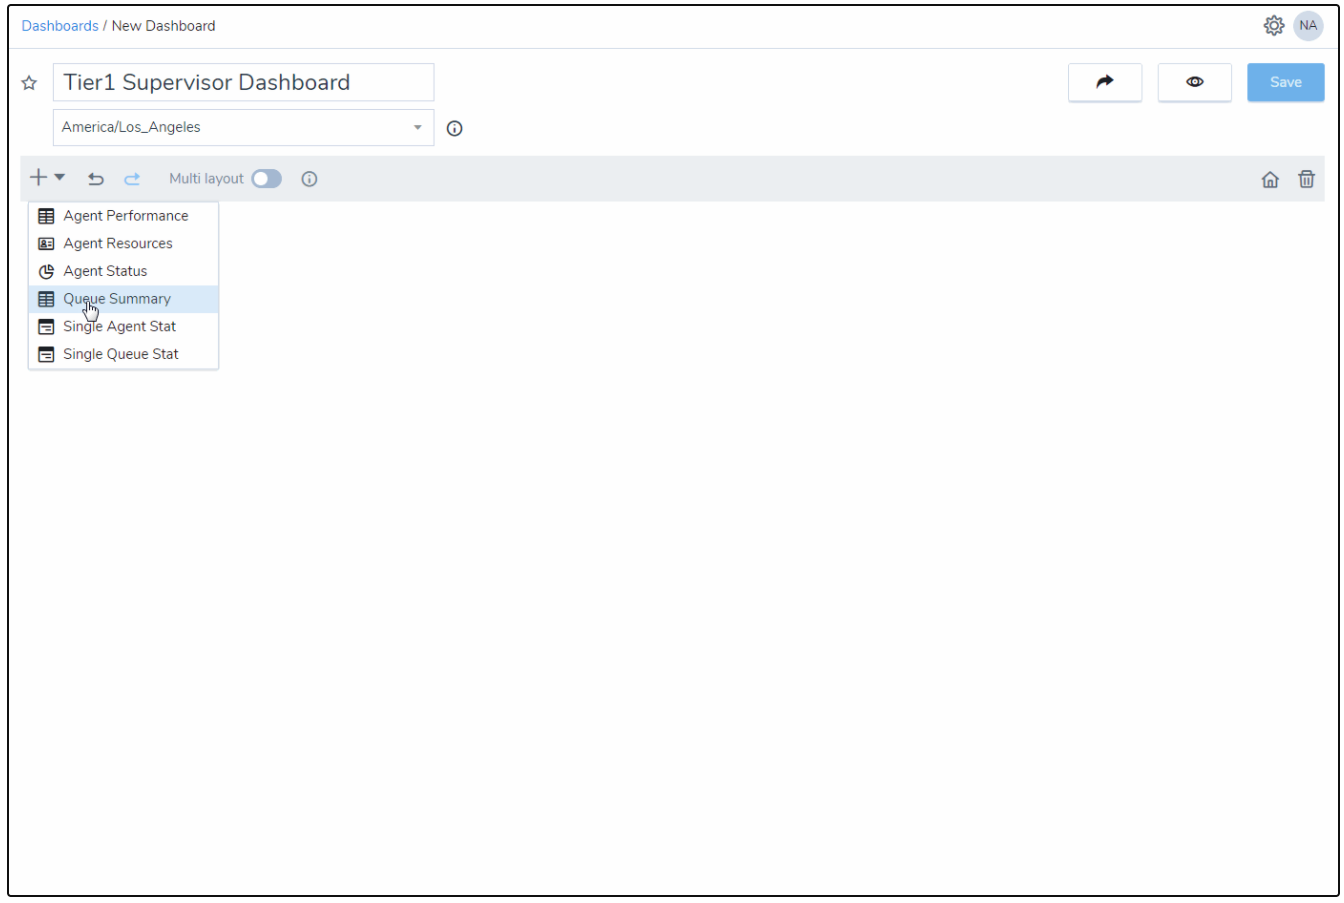
- Go to the Dashboards Tab and select New.
- Click
 , and select to add a Queue Summary widget from the drop-down menu.
- In the widget that opens on the right, enter the name of the widget.
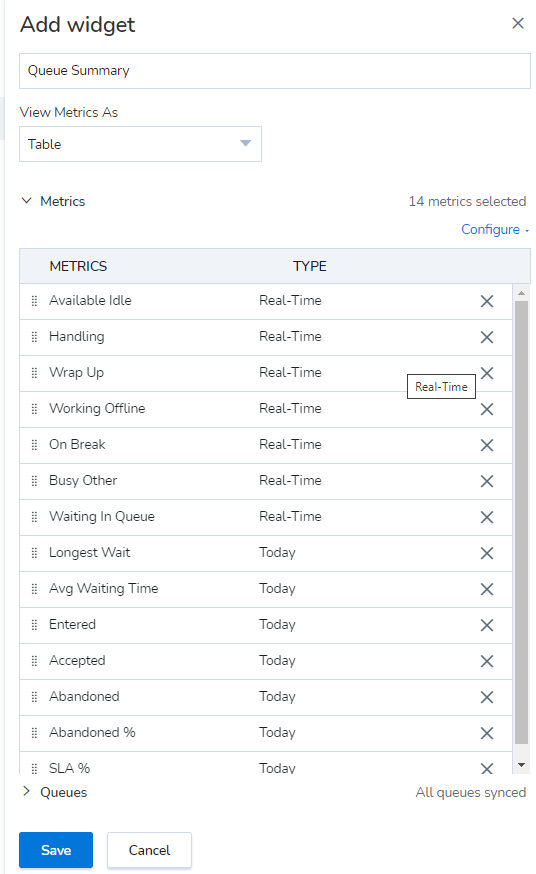
- Under View Metrics As, select to view the data in tabular or graphical format. The chart refreshes every five seconds.
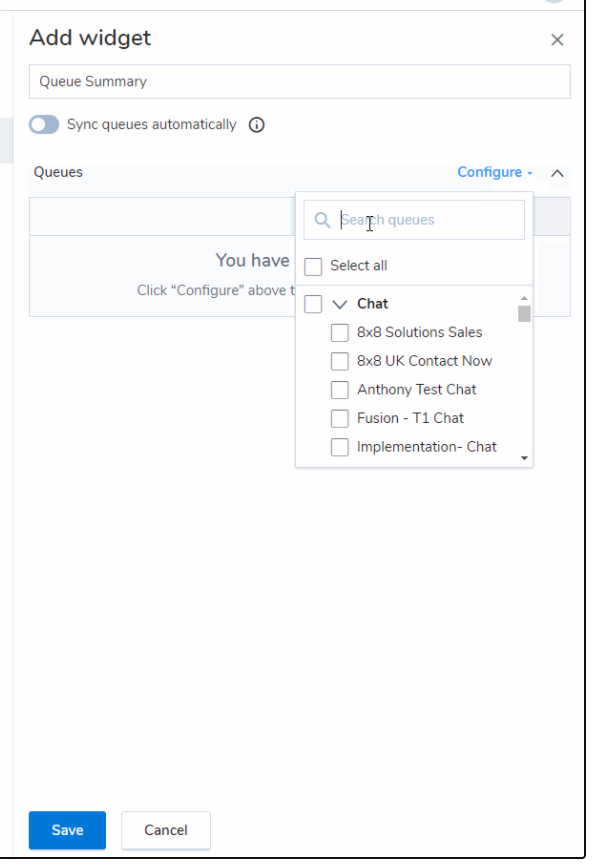
- Select the queues you supervise. Click
 next to Queues, and click Configure to select from the drop-down list of queues, or search the list to add specific queues quickly (John selects Tiers 1, 2, and 3).
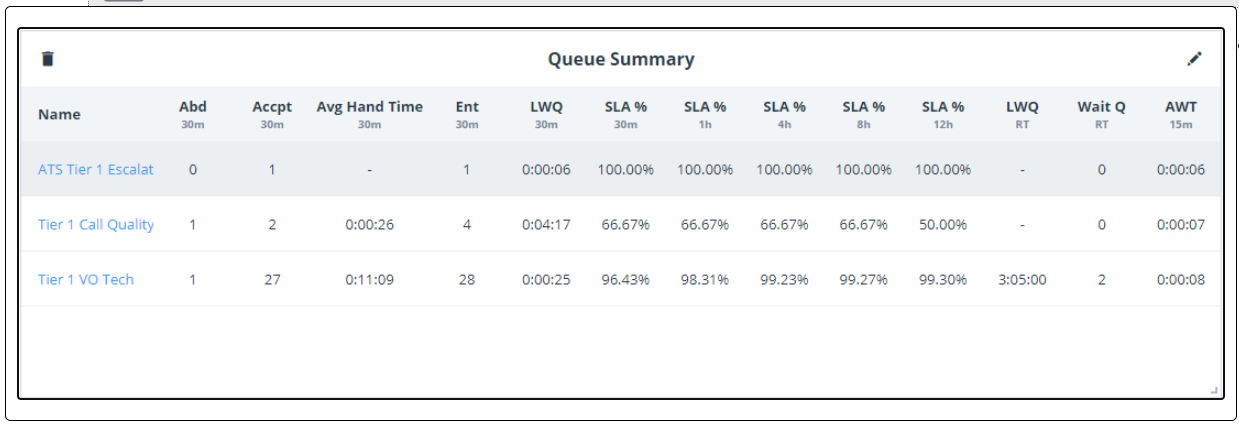
- Click Save. It saves the queue summary widget.
Additional Information
For more information on creating widgets, see Create a Dashboard Using Widgets.