Contact Center Manager Dashboard
Question
What is the Contact Center Manager Dashboard?
Applies To
- Fuze Discover
Answer
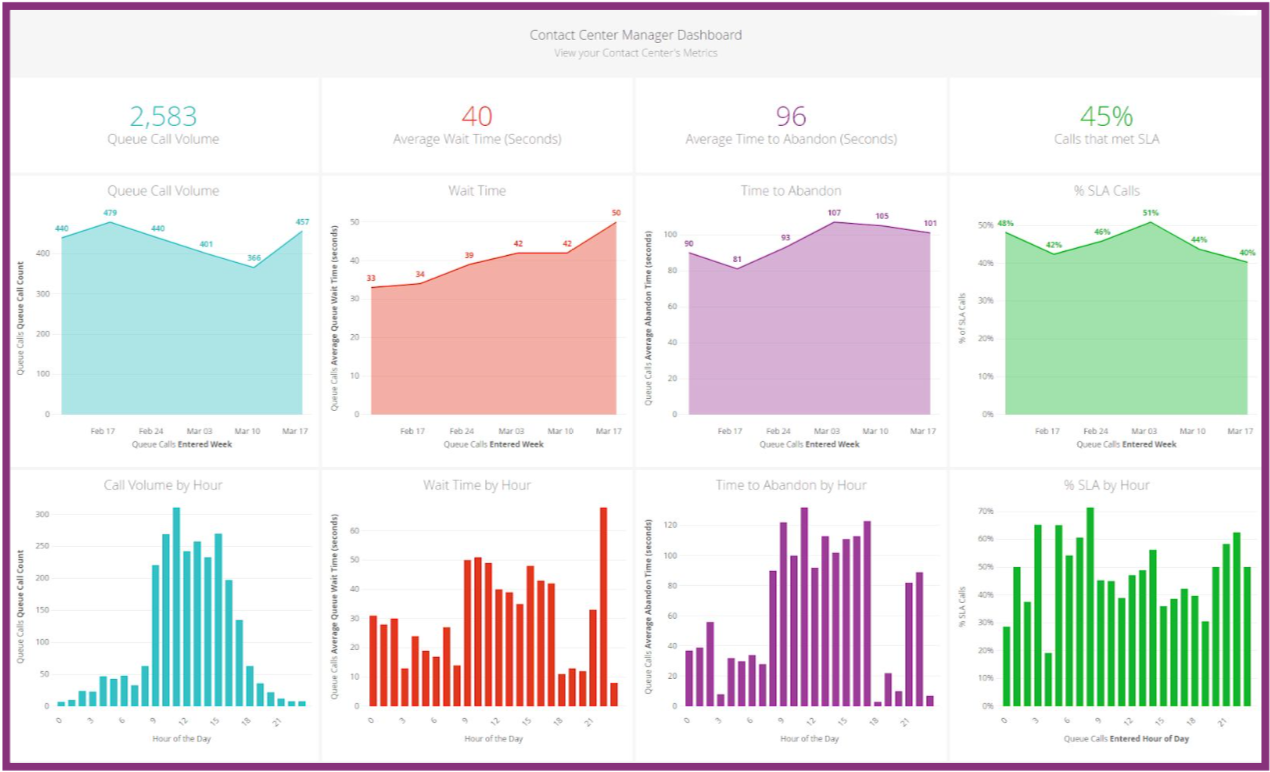
The Contact Center Dashboard is the newest pre-configured Dashboard included with Fuze Discover. It is comprised of Looks encompassing key Queue metrics for your organization.
What Looks are Included?
Looks are broken into four categories:
- Call Volume
- How busy are your queues? Call Volume measures the number of calls that a queue or collection of queues receives over a given period of time. These Looks provide insight into aggregate queue call volume and allow managers to identify trends and allocate contact center resources accordingly.
- Wait Time
- How long are customers waiting on the phone before connecting with an agent, and how has this changed over time? Similar to Call Volume Looks, Wait Time Looks allow managers to measure, identify, and act upon customer wait time trends.
- Time to Abandon
- How long are customers willing to wait for an available agent before hanging up? These Looks allow managers to understand their customer’s tolerance for waiting on the phone without being connected.
- SLA Calls
- Fuze allows customers to set an SLA for answering queue calls, measured in seconds. Calls that are answered within this predetermined time period fall into the category of an “SLA Call”. These Looks allow managers to keep up with their team’s ability to meet this SLA and diagnose the issue if too many calls fall outside of the SLA.
Each of the aforementioned categories are broken down into three Looks, organized in columns across the Dashboard. From top to bottom, this Dashboard includes:
- Numerical representation of the given queue metric for a provided period of time
- Visual representation of the queue metric’s trending weekly averages over a provided period of time
- Visual representation of the metric’s hour-by-hour averages over a provided period of time
Other Notes
By default, the Dashboard Filters show the past 30 days worth of data from every queue and exclude Saturday and Sunday. These Filters can be changed at any time and affect every tile on the Dashboard.