User Adoption Dashboard
Question
What is the Fuze Discover User Adoption Dashboard?
Applies To
- Fuze Discover
Answer
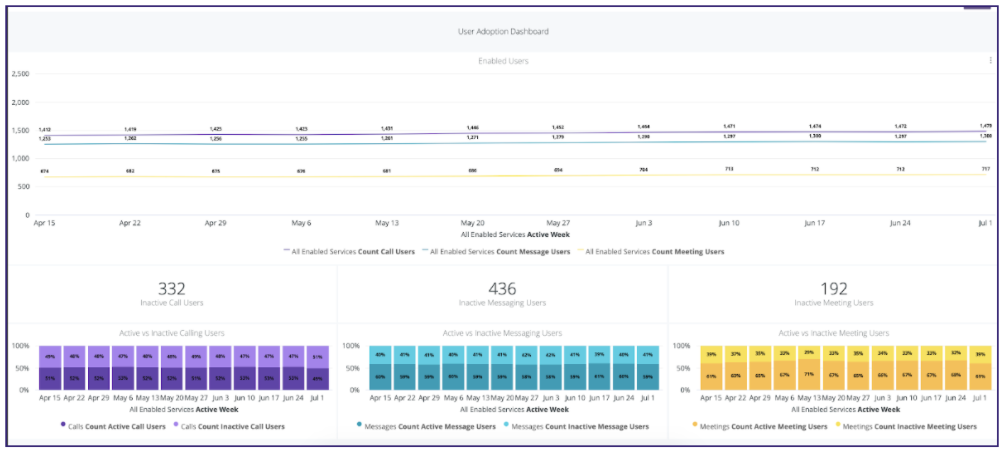
The User Adoption Dashboard is a pre-configured Dashboard included with Fuze Discover. It is comprised of Looks encompassing key Adoption metrics for your organization. Adoption statistics are broken into 3 different categories: Calls, Messaging, and Meeting.
Common Terminology
- Enabled Users: A user who has access to use calls, meetings, and/or messaging.
- Inactive Users: An enabled user who has not generated an action to be considered an active user in its respective categories within the time range of the dashboard.
- Active Users: An enabled user who has generated an action to be considered an active user in its respective categories within the time range of the dashboards.
Active User Qualifier
- Calls: Enabled users that have placed a call OR answered a call within the time period. The answered call must have a disposition of “Answered” to be considered an answered call.
- Meetings: Enabled users that have hosted a meeting.
- Messages: Enabled users that have sent a message.
What Looks are Included?
- Number of Enabled Users Per Fuze Service: The look shows you all users that have access to one or more of the three main categories (calls, meetings, and/or chat). A user that has access to more than one category will be represented in all categories individually.
- Inactive Users: This will list how many users are inactive in each category within the time frame selected. You can drill down to the full list of users by clicking on the Inactive hyperlink beneath the number.
- Active vs Inactive Users: This will show the percentage of active vs inactive users for each category grouped by the selected time frame (default time frame is weekly).
- Adoption Rate for Top 10 Enabled Users (Locations/Departments): Adoption rate for top 10 locations/departments for each category. This is sorted by the highest number of enabled users available in each location/department.
Other Notes
By default, the Dashboard Filters show the past 12 weeks worth of data. The dashboard has the following filters built-in: location, department, and date range. These filters can be changed at any time and affect every tile on the Dashboard.