Using Looks
Objective
Using Looks in Fuze Data.
Applies To
- Fuze Discover
Procedure
Looks are reports that are built in an Explore using data, filters, and visualizations. You can save Looks, share Looks with other people in your organization, or include Looks in a Dashboard.
Changes that you make affect the Look for other users, only if you save the changes you make while in Edit mode. For details about how to edit and save Looks see Saving and editing Looks from an Explore.
Expand a section below to view detailed information about Looks.
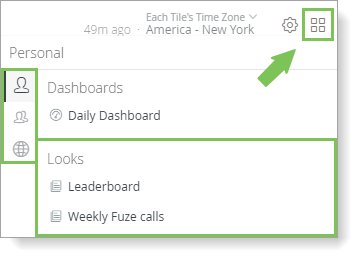
Accessing Looks
In Discover, access Looks from Dashboards or the Personal, Group, and Shared sections of the Discover menu. The Discover menu is located in the top-right corner of each Dashboard and Explore.
Additionally, you can use a Look as a starting point for further exploration of data. While in a Look, click the gear menu and select Explore from Here to open an Explore that contains the data query, filters, and visualization that creates the Look.
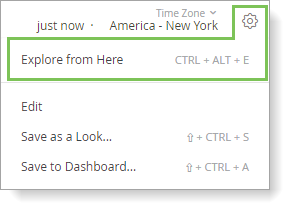
See the article Exploring Data for more details about the features and options available in Explores.
Understanding the Parts of a Look
Looks that you can view include some or all of the items explained in this section. See Accessing Looks to view the items in this section.
Toolbar
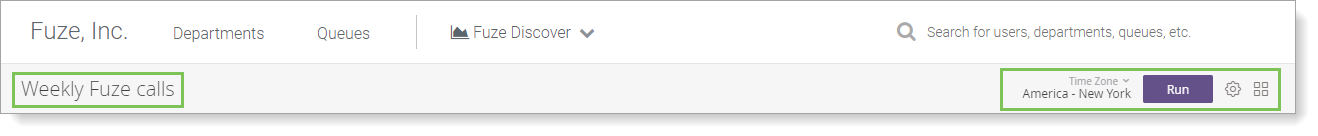
The name of the Look is displayed on the left of the toolbar. On the right, the Time Zone, Run button, gear menu, and Discover menu are available.
Choosing your Time Zone
The current time zone is displayed in the top-right to the left of the Run button. Click on the Time Zone to display the time zone options, and select the correct time zone.
The time zone setting affects what data is returned when some filters are applied. For example, the Time Zone value impacts results when filtering data for today or yesterday.
Filters
The Filters section lists the filters that are applied to the Look.
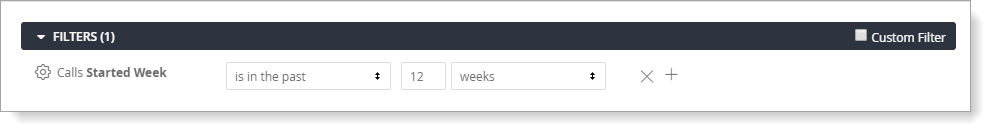
Add filters to the Look from the Explore pane on the left side of the screen, or manipulate the existing filters in the Filter section. To view Look with new or edited filters applied, click Run.
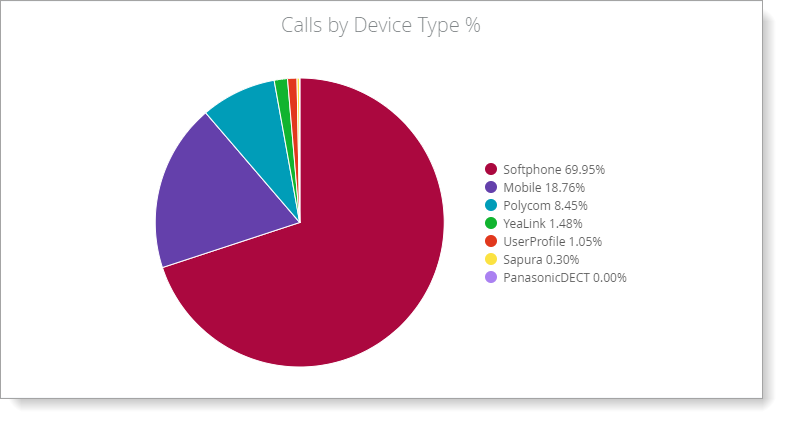
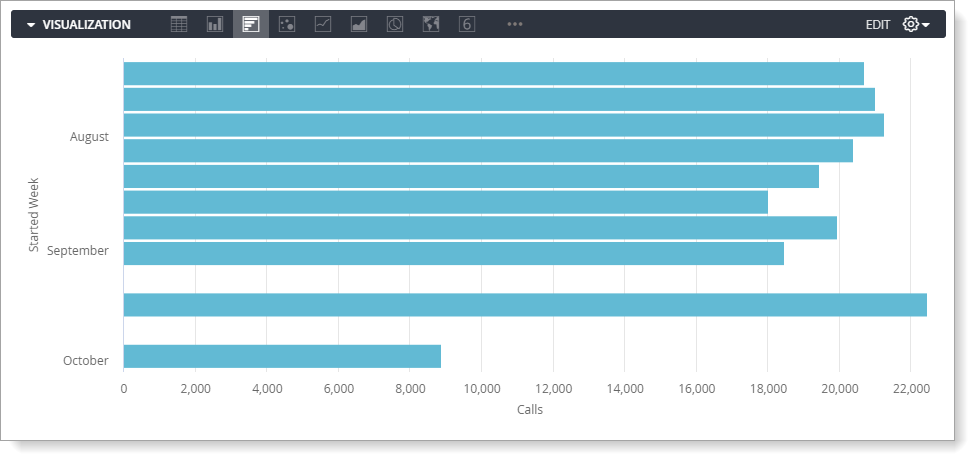
Visualization
The Visualization section contains the chart options that are available to display the Look’s data.
Data
The Data section displays the Look’s underlying data.
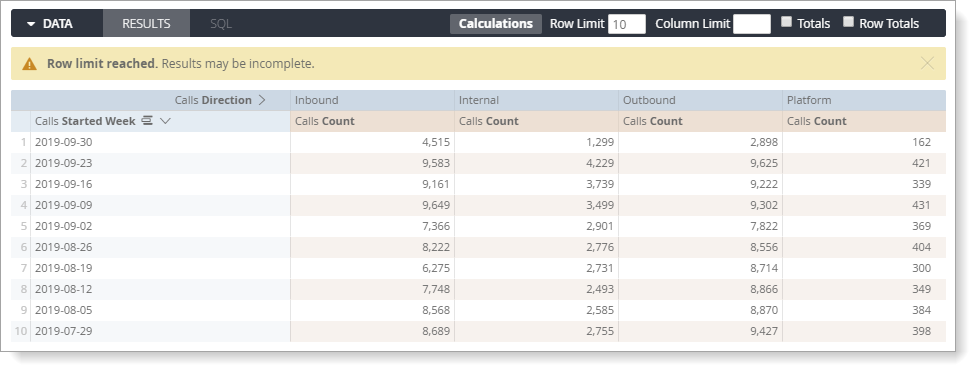
The Data section provides the following filter options:
- Sort columns: To sort a column, click on the column header. If necessary, Discover reruns the Look automatically.
- Row Limit: Enter the number of rows that you want the Look to display.
- Column Limit: Enter the number of columns that you want the Look to display.
- Totals: Select to add a row to the bottom of the data that displays the column totals.
- Row Totals: Select to add a column on the right that displays the row totals.
If you make changes to the Data section, click Run to view the changes.