Fuze Discover Overview
Question
What is Fuze Discover?
Applies To
- Fuze Discover
Answer
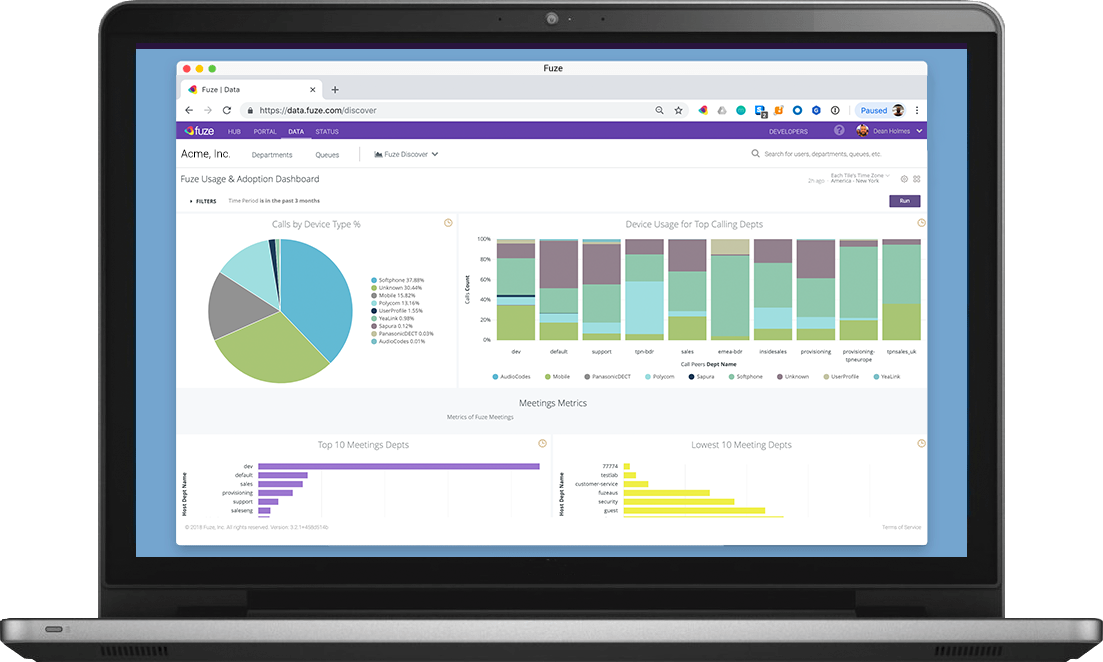
Fuze Discover is a powerful analytics tool that is designed to help you gain insight into your organization using historical data ranging from 24 hours to 2 years ago.
You can comprehensively evaluate metrics including but not limited to usage trends, workforce performance, customer engagement, sales metrics, and employee adoption.
Starting from a series of prebuilt reports that are organized into theme-based dashboards, you can explore the data behind reports, customize or build your own reports using a variety of data sets, share saved reports and dashboards, and configure Discover to automatically run and export reports on a defined schedule.
Key Components of Discover
The following sections describe the key components you need to understand before you get started with Discover.
Dashboards
Dashboards are collections of one or more saved reports. In Discover, saved reports are called Looks.
Discover includes several prebuilt dashboards for your convenience. Additionally, you can build, save, and share your own reports.
Looks
Looks are created by applying parameters, filters, and visualizations (e.g., charts) to data sets.
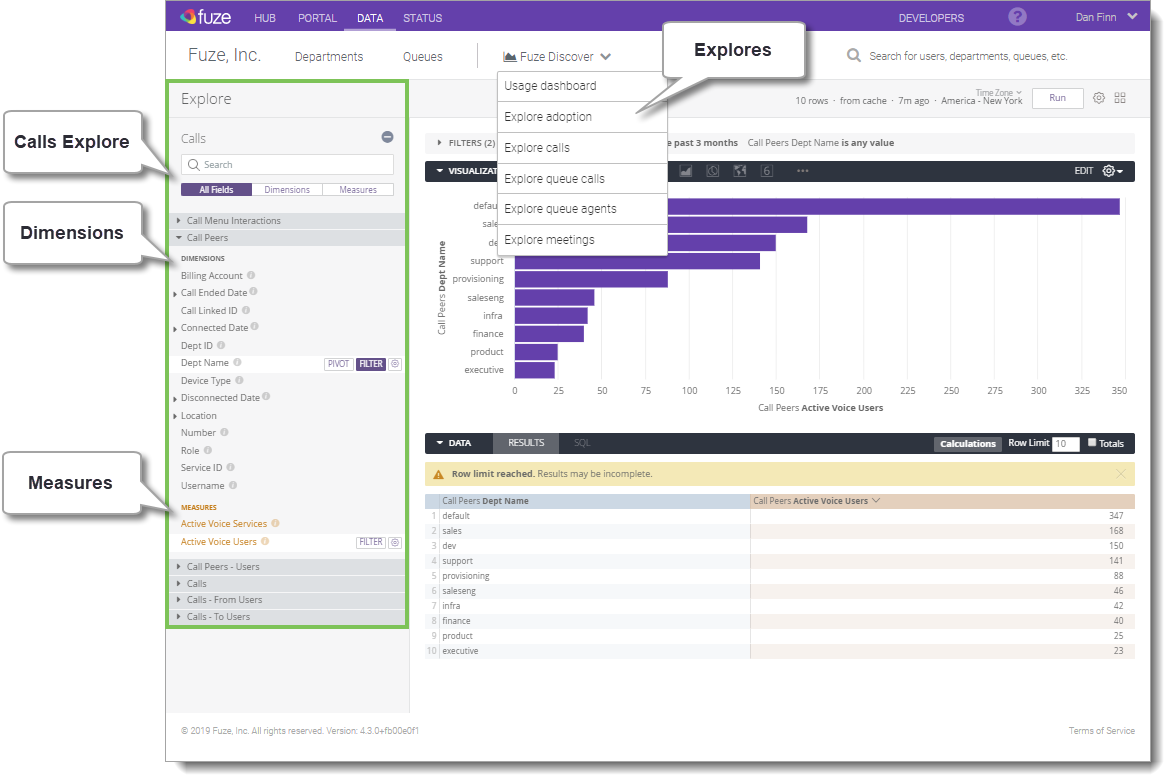
Explores
Explores are data sets (like calls, meetings, and product adoption) that are comprised of Dimensions and Measures that you use for analysis and as the basis for building Looks.
For additional information about Explores and running your own reports, see Exploring Data.
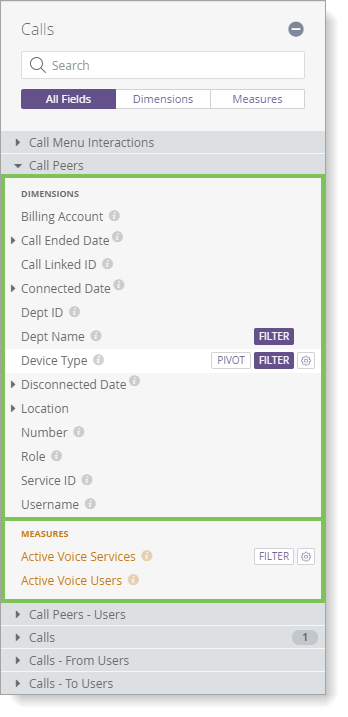
Dimensions and Measures
Dimensions are the data points (e.g., Device Type) in an Explore. Measures are the parameters (e.g., Count) that you apply to Dimensions in an Explore.
How to Access Fuze Discover
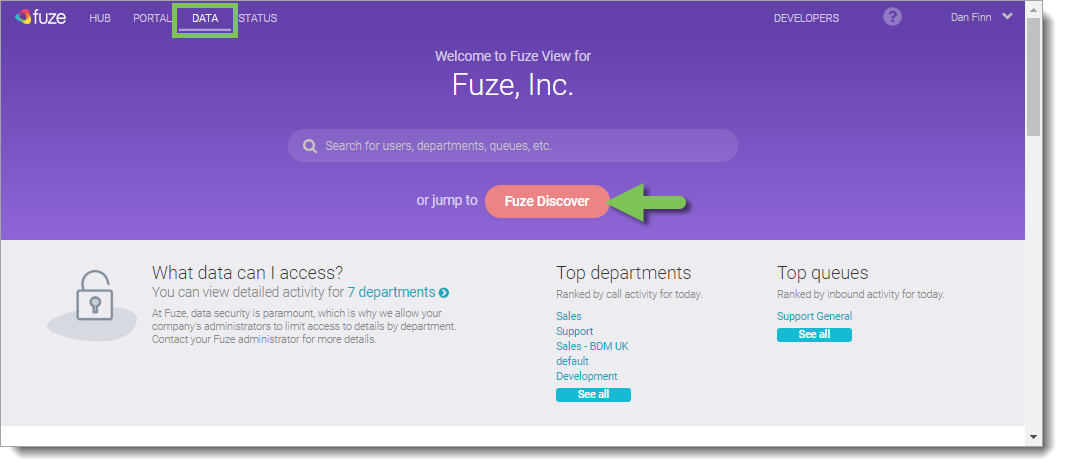
If you have a Fuze Discover license, you can access Discover from the Data tab of the Hub using the Fuze Discover button at the top of the screen or the banner at the bottom with a button labeled Start Exploring. You can also navigate to Discover by navigating to https://data.fuze.com/discover.
Requirements and Permissions
Use the current version of Fuze Discover and one previous major version of the most popular web browsers: Google Chrome, Mozilla Firefox, Microsoft Edge, or Apple Safari.
To learn more about obtaining a Fuze Discover license, contact Fuze Support.
If you have a Discover license and would like to know how to add Discover users, refer to our Administrator guide for Adding Fuze Discover.
Key Terms
- Explore: A collection of data sets that users can query. Fuze Discover currently has three Explores based on different sets of data. They are: Calls, Meetings, and Queues.
- Dimension: A field used to filter query results. Examples of dimensions include:
- an attribute, which has a direct association to a column in an underlying table
- a fact or numerical value
- a derived value, computed based on the values of other fields in a single row
- Measure: A field that uses an aggregate function, such as Call Count, Ring Time, and Total Duration. Any field computed based on the values of other measure values is also a measure. Use measures to filter grouped values.
- Look: A saved report built in an Explore that can be retrieved by name and shared with other people in the organization. You can add Looks to Dashboards.
- Dashboards: A collection of saved Looks displayed like tiles together on one page.
- Filter: Use filters to restrict the data you are viewing to items of interest. For example, you might limit the results to certain dates, customers, or locations. You can use any field in your Discover instance as a filter.
- Pivot: Multiple dimensions are often easier to look at when you pivot one of the dimensions horizontally. After clicking Pivot for a particular dimension, each value in the dimension becomes a column in your Look. This makes the information easier to consume visually and reduces the need to scroll down to find data.